The Ultimate HR Guide to Gain Leadership Buy-In
- How to complete the Cost Analysis.
- How to understand the research and data.
- How to present the findings to executives.
- How to complete each of the calculations.
Table of Contents

Introduction
Getting Started
Step 1: Download Your Free Cost Analysis
If you haven’t already, make sure to download your FREE Employee Engagement Cost Analysis to receive the tools you need to gain executive buy-in! You'll receive:
- A branded one-page Cost Analysis to easily customize and present your results.
- A Reference Page highlighting all calculations and research sources.
- A Sparck Engagement Calculator to personalize results based on your company or department data.
The Cost Analysis isn't just a tool to gain buy-in for an organizational strategy, it can also be used to evaluate different departments and teams to see how an increase in employee engagement can impact their business performance. The opportunities are endless when it comes to engagement and should touch every part of your organization to get the greatest return on investment.
Step 2: Choose Your Own Adventure
Here are three options for you to quickly capture the information you want:
If you’re the visual type and are short on time, we have a short video, that will introduce you to the Cost Analysis and walk you through how to use the Calculator.
If you’re really short on time, no worries! Click Here and we’ll prepare a Cost Analysis for you. We can set up a time to personally walk you through the results at your convenience.
Scroll down and we'll walk you through the Cost Analysis. We'll give you an overview, break down each of the sections with an executive summary, and provide links to more detailed calculation explanations. Let's get started!
Download Now!

Cost Analysis Overview
The Cost Analysis is designed to:
- Help you and other business leaders get executive buy-in to invest in engagement strategies.
- Create alignment between HR related initiatives and organizational outcomes.
As we noted before, the Cost Analysis isn't just a tool for an organizational strategy. It can also be used to evaluate different departments and teams to see how an increase in employee engagement can impact their business performance. The opportunities are endless when it comes to engagement and should touch every part of your organization for the greatest return on investment.
For the remainder of this page, we’ll walk through each area of the Cost Analysis to ensure you are prepared and ready to gain executive buy-in. The Cost Analysis is separated into two main sections that we will review: Company Projections and Company Solutions (as noted on the left).
Sparck Calculator Overview
This calculator is a tool to help you determine the financial numbers you need to complete your Cost Analysis Overview (see section above).
The first step is inputting your company data into the the yellow fields (highlighted in the orange box on the right):
- Turnover Rate (if you don't have this, we've got you covered)
- Annual Revenue
- Number of Employees
- Average Salary (Entry and Executive Levels)
Once you input your data, the calculations will automatically populate! The values will display in the blue boxes below, each titled section directly correlates with the fields on the Cost Analysis so you can easily transfer them over. Learn more about the features of the Sparck Calculator by clicking the button below!


Company Projections Section
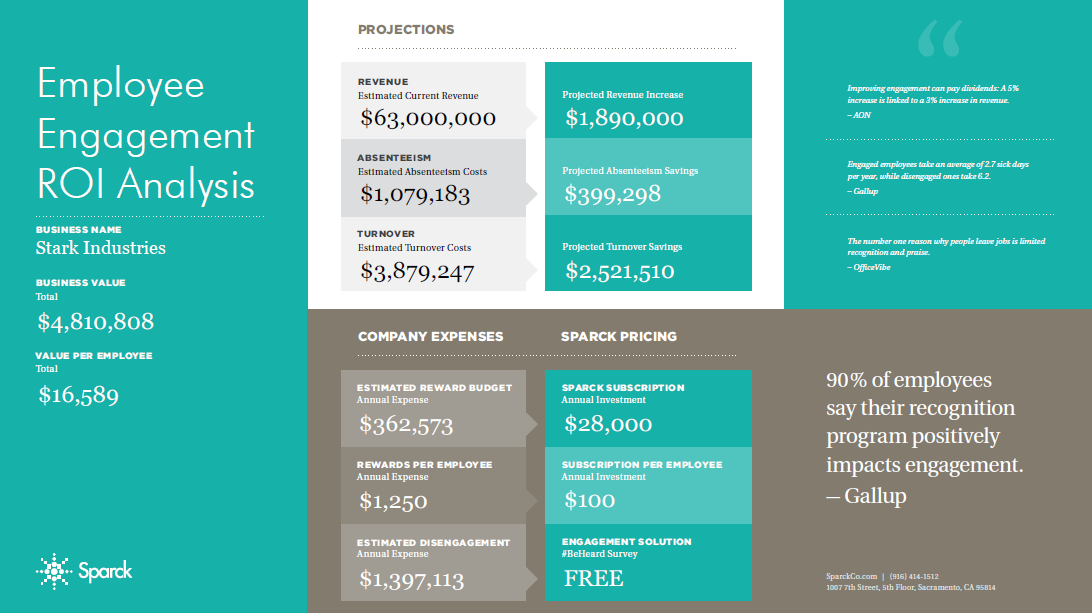
Back to the Cost Analysis Overview, let's start at the top of the page with Projections. Once you have the values from the Sparck Calculator, you can input your data in the area outlined by the orange box on the left.
The Company Projections section focuses on three areas where you'll see the largest financial savings with increased engagement in your organization:
- Revenue: Engaged employees are more productive, which makes the company more profitable.
- Absenteeism: Engaged employees take less time off of work.
- Turnover: Engaged employees don’t want to quit.
Highlighted in the white box with the connected arrow to the left, we include research-backed facts supporting these company projections. These will be helpful to reference in your meeting to build credibility. For those executives that want more information, on the second page of the cost analysis we provide an in-depth look at each calculation and cited source.
As a bonus, we include Total Business Value to the left of the page highlighted in the gray box. This is the projected increase and savings of the three key financial areas in the projection section to show the total opportunity cost with increased engagement. This is a great way to conclude this portion of the Cost Analysis in the meeting.When it comes to ROI, revenue is at the top of the list for many executives. The Revenue section shows the projected increase you can have by boosting employee engagement in the workplace.
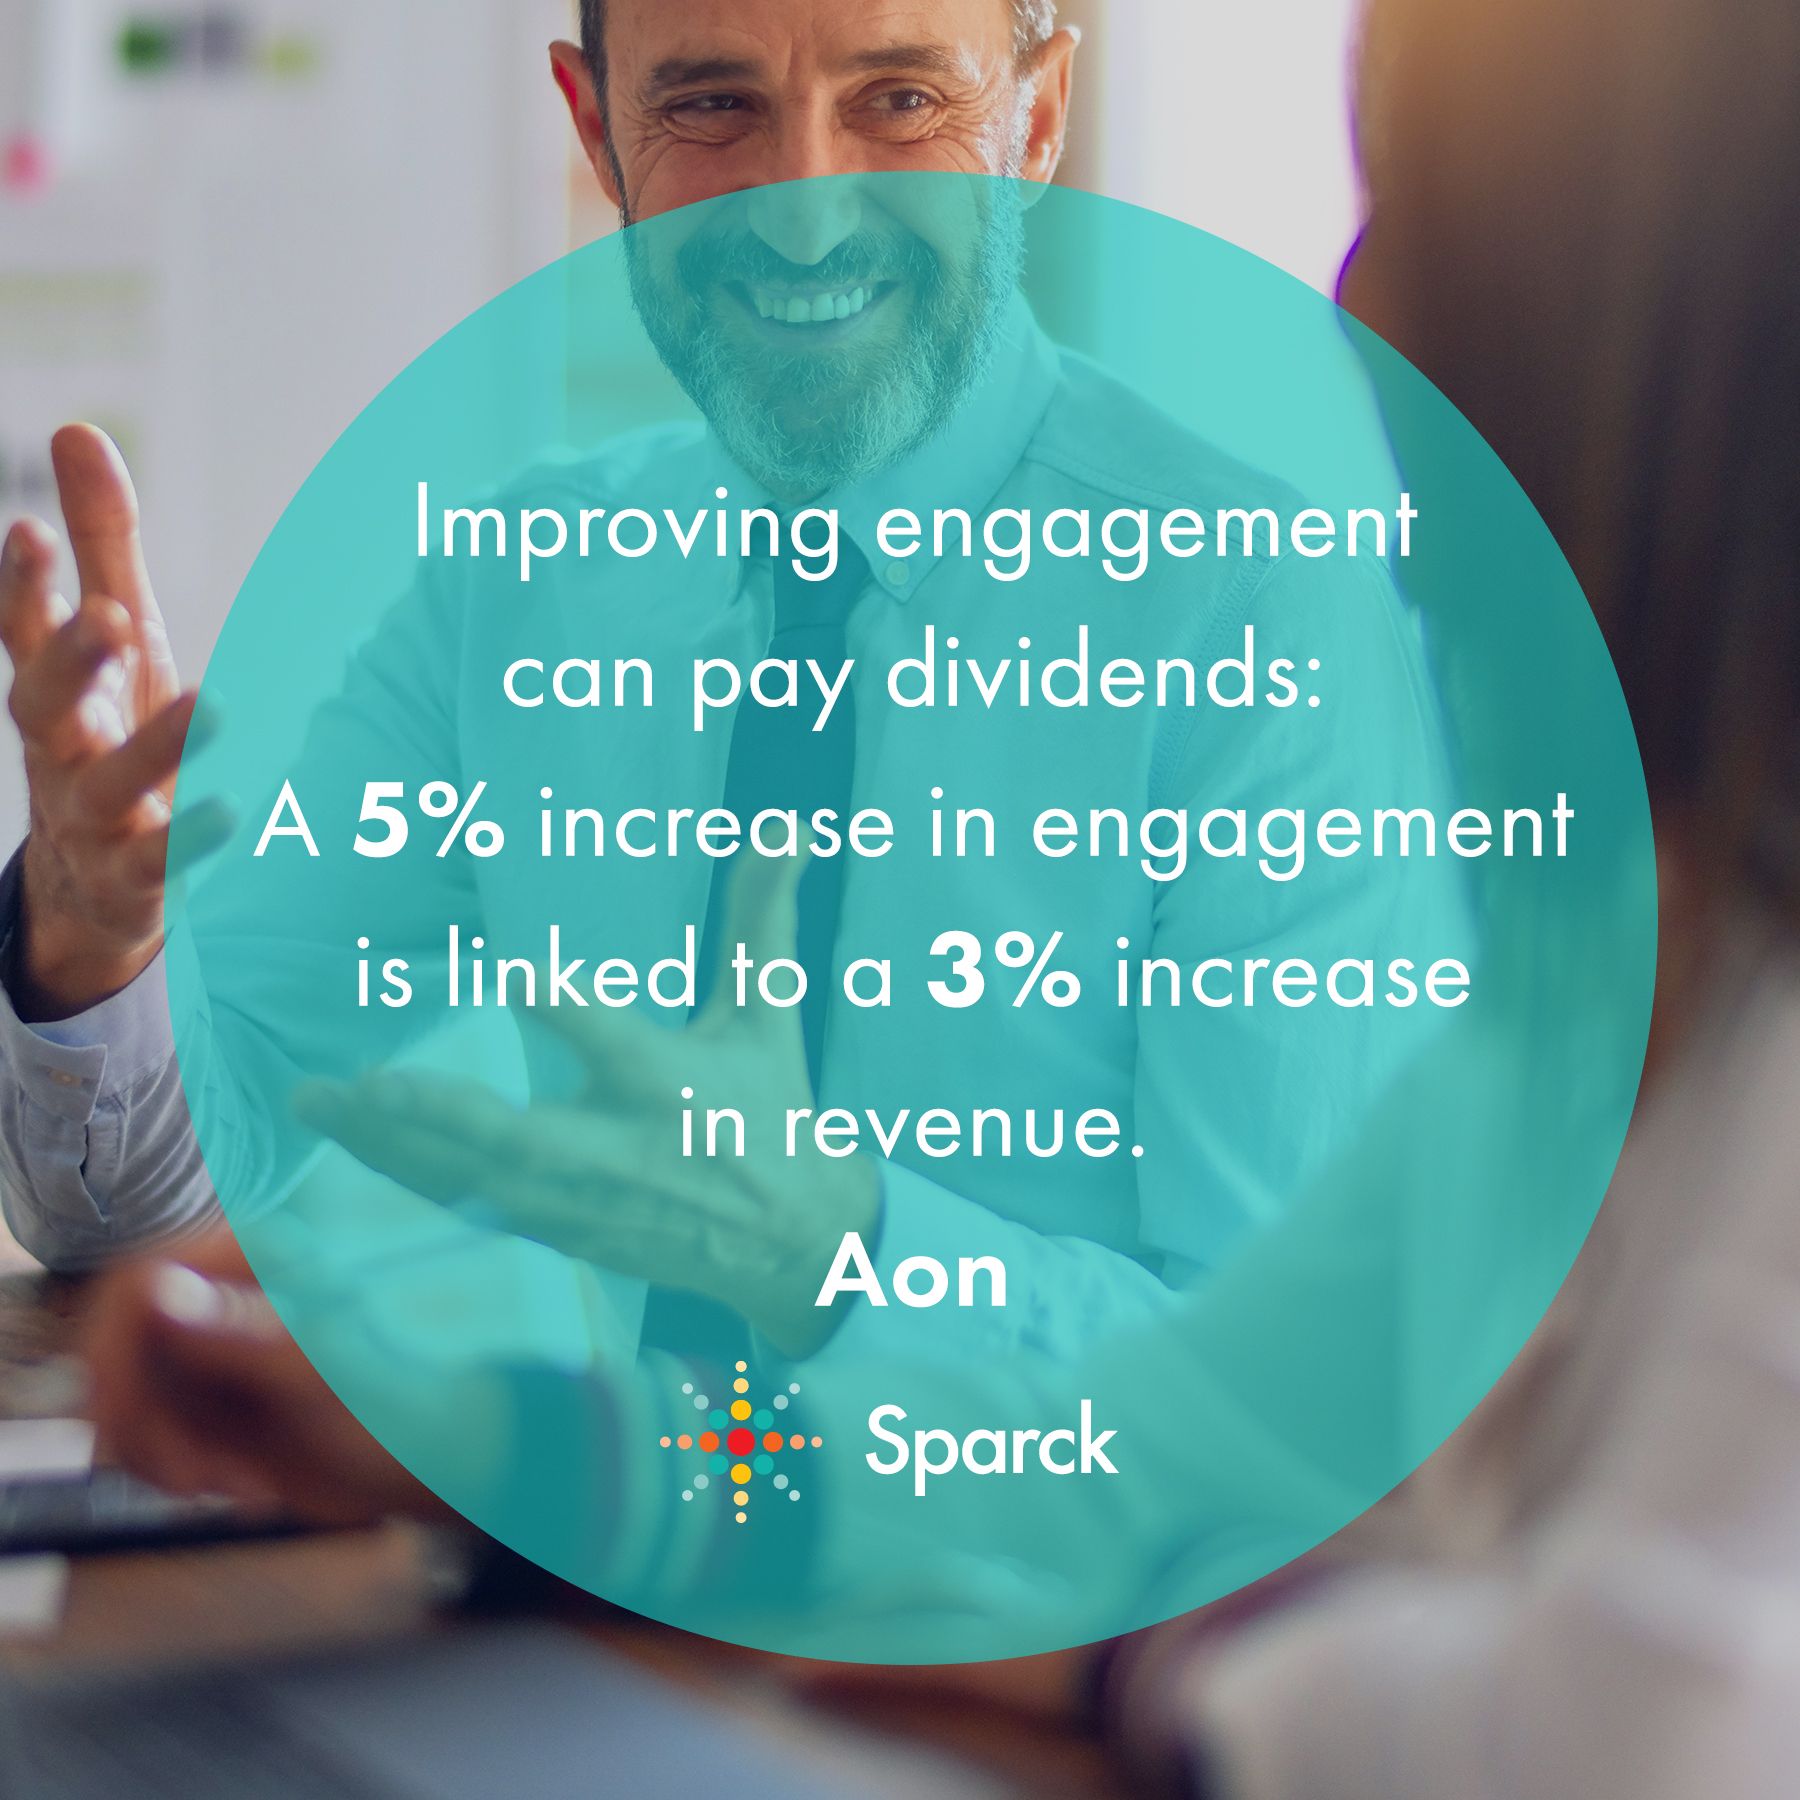
Engaged employees are more committed and productive, which drives revenue and efficiency. This is proven based on a study by Aon, which found a direct correlation between engagement and revenue. Companies that increased employee engagement by a mere 5%, directly increased their revenue by 3%.
To calculate the Projected Revenue increase, we just need the annual revenue for the company or department (this is one of the inputs for the Sparck Calculator).
CLICK HERE TO READ MORE
The second section is absenteeism. The most important thing to highlight here is that an increase in engagement can reduce the number of “sick days” which increases productivity and saves money.
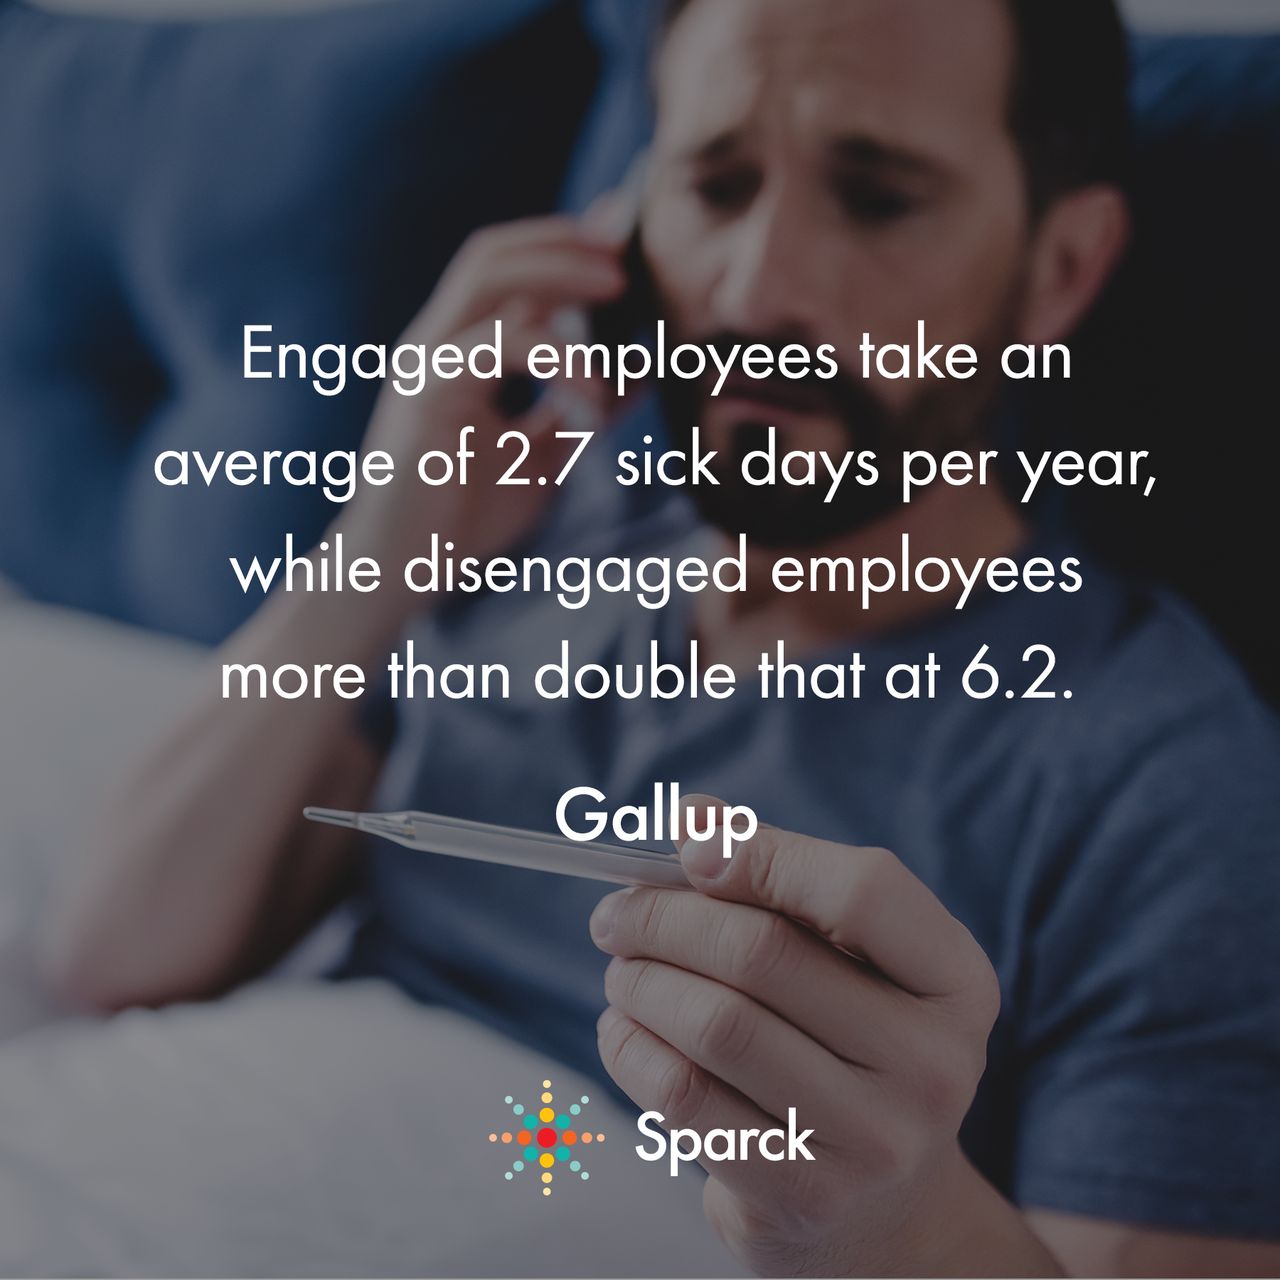
Engaged employees take an average of 2.7 sick days per year while disengaged employees double that with an average of 6.2 sick days. This is important because when someone takes a “sick day," you are paying for their time off while losing their productivity. Lost time and money is never desirable!
Luckily, increased engagement saves about 37% in absenteeism costs by converting those disengaged employees into more committed and engaged individuals who won’t take as many “sick days.” This shift creates an opportunity to save money and increase productivity by keeping your employees excited about their work and invested in the organization.
To uncover these cost savings, we first look at the financial impact it has on a company when an employee takes a sick day. You lose productivity and money because you're still paying for that time even though no work is being done. In order to measure these two areas to get the total absenteeism costs, we have to see how much productivity (Revenue per Employee) and money (Average Salary) is being lost for each employee.
This is a quick introduction to the Absenteeism Costs section, but we have additional resources to share more insights and show how these calculations are broken down step-by-step.
CLICK THESE LINKS TO READ MORE:
Turnover is the third section where you will get the greatest return on your investment. It’s especially intriguing because there’s a tremendous opportunity to increase retention by making engagement a strategy.
It's extremely painful, culturally and financially, when someone leaves. It takes an average of 42 days to fill a vacant position, and that doesn’t even include the time it takes to get a new employee trained and up to speed. There’s so much time and money that's wasted when losing an employee, and not to mention stress for the team! But here’s the silver lining, and the part that we are excited to share:
65% of the employees who quit do so voluntarily! You have a huge opportunity to win back a large majority of the 65% who are leaving!
Most often, great employees leave companies because their needs are not being met...yet! This presents a targeted engagement opportunity to retain this talent and save money, time, and productivity. When calculating the projected turnover savings, we zeroed in on this opportunity cost to spotlight what is possible with increased engagement.
This is a quick introduction to the Turnover Costs, but we have additional resources to share more insights and show you how these calculations are broken down step-by-step.
CLICK THESE LINKS TO READ MORE:
- Calculating Turnover Costs and Projected Savings
- Step-by-Step Calculations for Turnover Costs and Projected Savings
- If you don't have your company's turnover rate, learn how the Sparck Calculator can help you
A great way to conclude this section of the Cost Analysis is to recap the total financial opportunity based on the impact that increased engagement will have on Revenue, Absenteeism, and Turnover costs.
This number is included on the far left of the Cost Analysis under the Business Name. We also include the Value Per Employee by dividing this overall number by headcount. This summarizes the potential opportunity cost.
By this point, most executives are interested, especially because these numbers are based on proven research from credible sources, but now they want to know how they can capture these financial savings. It’s the perfect segue into the next section of the Cost Analysis, your proposed solutions.
CLICK HERE TO READ MORE
Company Solutions Section
The bottom section of the Cost Analysis outlines the current business expenses and a comparative pricing list to introduce the most popular engagement investments to reap the financial benefits highlighted in the Company Projections section. We're talking about employee recognition and employee surveys.
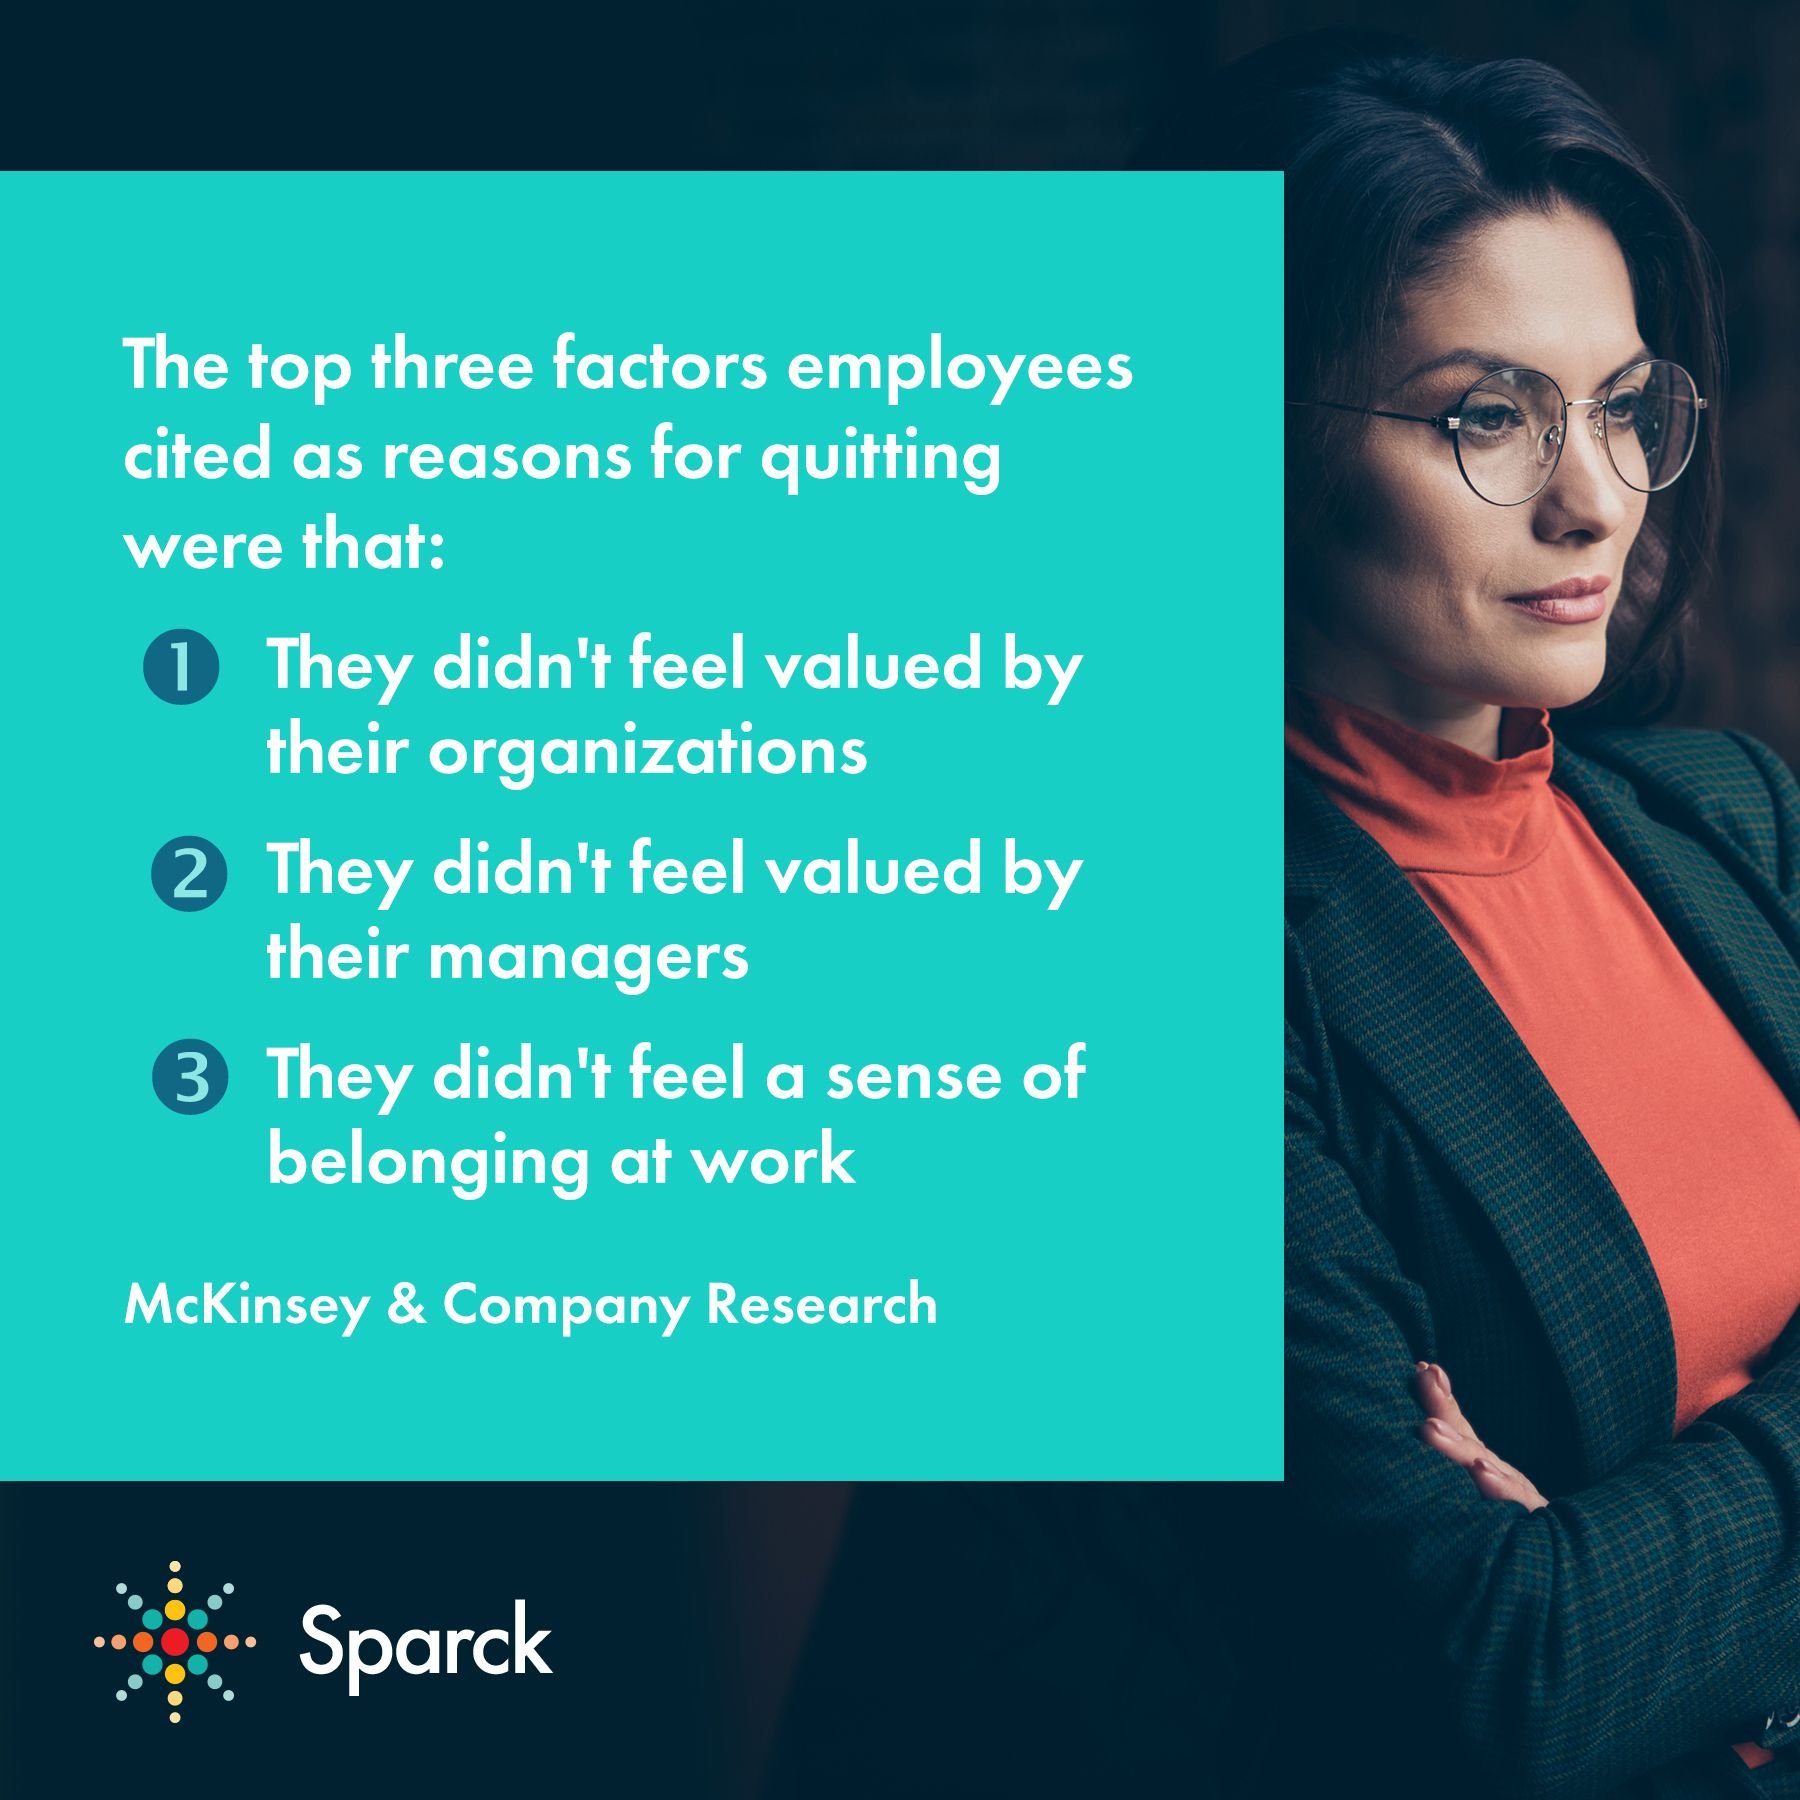
Did you know that 90% of employees say that recognition is what helps drive more engagement in the workplace, yet nearly 8 out of 10 employees resign due to not being recognized enough?
As a reminder, the Turnover Section of the Cost Analysis is calculated based on Aon's research showing that 65% of employees quit voluntarily. The number one cited reason why employees quit is because they don't feel appreciated. It’s human nature, people are hungry to feel valued and employee recognition will pay off tremendously as part of your engagement strategy.
Let's get started with the solutions section!

Let's begin with the two most common questions we receive in this section:
1. What Should Be Included in a Recognition Budget?
Depending on your company culture, there are a variety of options. However, it’s important to align the program to recognize and reinforce the desired success behaviors needed to reach company goals and objectives. This will be unique to each company.
For example, you may want to include workiversaries, performance based goals, birthdays, innovation, or safety. You'll want to exclude employee raises and bonuses because they are typically not included in a recognition program.
It's important to note that this is is a very intentional process, a one-size-fits-all recognition plan won’t work. You have to take the time to understand the employees in your company. It’s critical to acknowledge that everyone is different and the reward and recognition strategies will likely differ between generations and position type.
2. How Much Should We Budget for a Recognition Program?
Research shows that US employers spend an average of 1% - 2% of an employee’s annual salary on company rewards and perks for the year. Because of this, we use 1.5% as an overall average to calculate an estimated annual reward budget in the Cost Analysis.
We multiple the 1.5% by the average salary to get the budget per employee. And then multiply that by the number of employees in the division for the total budget. This automatically populates in the Sparck calculator.
CLICK HERE TO READ MORE
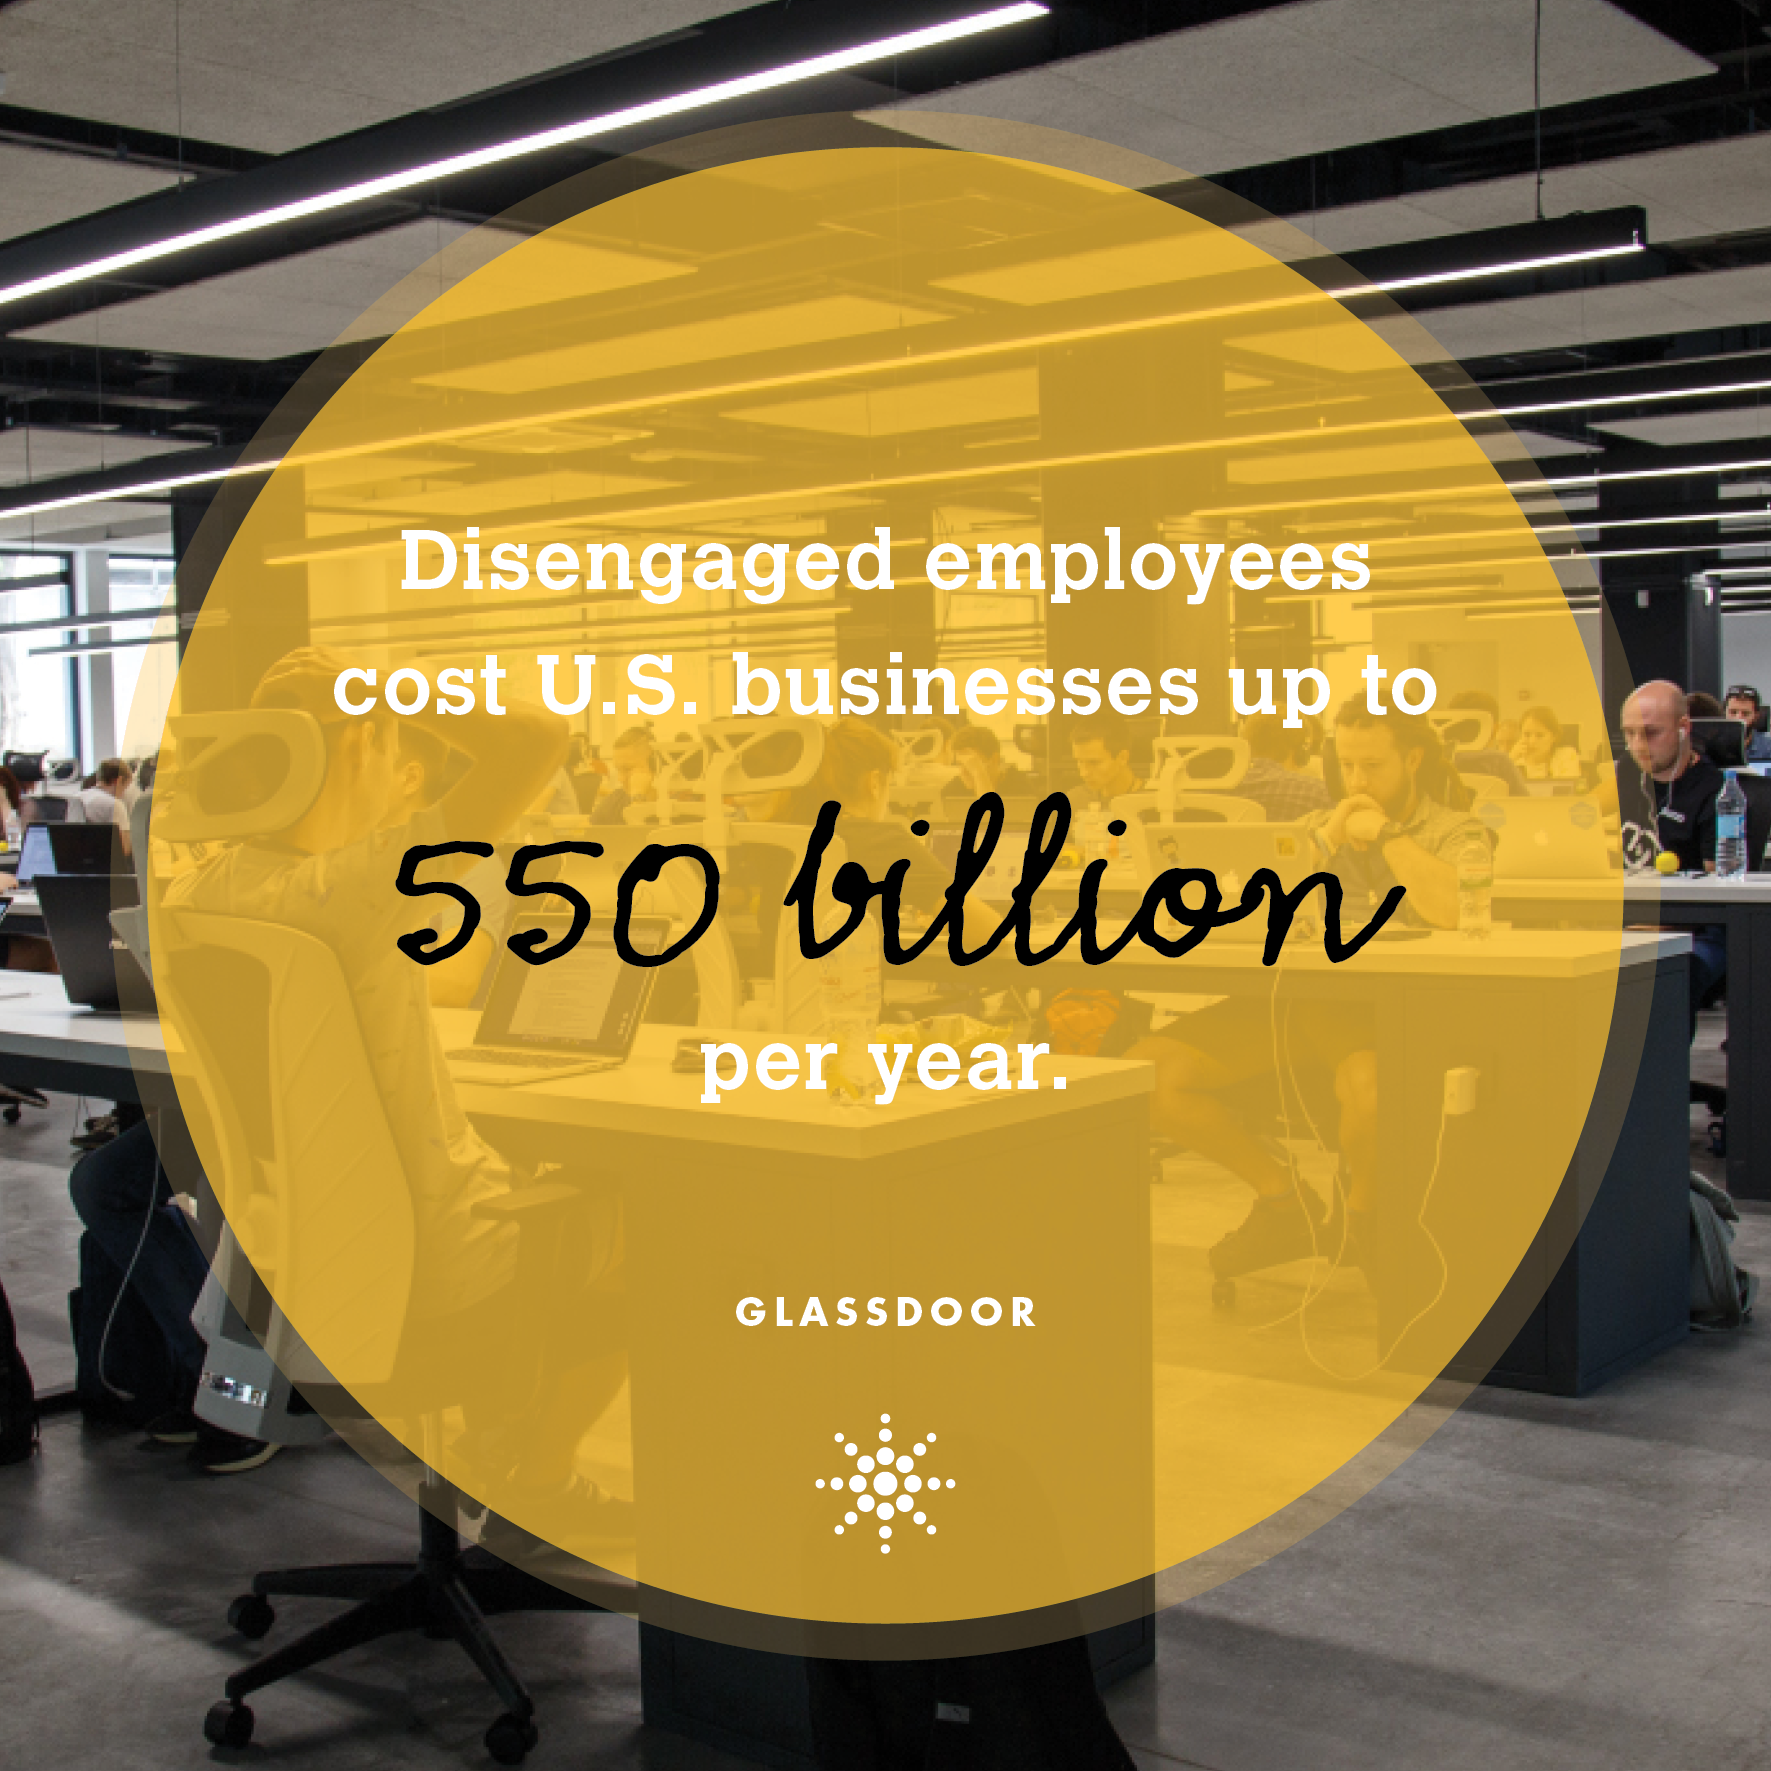
Here we are on the last section - time to wrap it up! Let’s talk about the financial impact of disengagement in your workforce.
In this section we highlight the amount of money lost in employee productivity due to disengagement. It’s more accurate to get a specific benchmark within your company using an employee engagement survey, but if you don't have that available we use Gallup's research for our Sparck calculator.
Sadly, Gallup has found that an average of 17% of the workforce is highly disengaged! These are the employees who are most likely showing up late, missing deadlines, and surfing the internet for open positions at work. This probably won’t come as a shock, but disengaged employees aren’t working as hard as those who are engaged and it’s losing the company a lot of money. On average a disengaged employee is costing the company about 34% in lost productivity.
The great news is that there’s an opportunity to turn that around! Engagement strategies can capture their commitment and excitement again.
CLICK HERE TO READ MORE
If you are interested in knowing exactly how engaged your workforce is and you don’t want to use national averages for your Cost Analysis, we’re here to help.
We have a FREE Report of our statistically valid #BeHeard Employee Engagement Survey!
Yes, you read that right - FREE! We know most executives love that word, so we had to make it happen - especially after COVID hit! We even have a Resource Page to walk you through all of the survey stages, from Getting Buy-In to Taking Action After the Survey to increase participation and gather quality results.
If you want to dig deeper, there's also an opportunity to upgrade to the Premium Report to personalize your engagement strategies throughout the organization to capture the financial savings in your Cost Analysis.
CLICK HERE TO READ MORE

Executive Team Presentations
So now that you have your Cost Analysis results, it's time to present to your executive team and get their buy-in.
Check out some of our recommendations and best practices to rock your meeting. If you want more information, we are here to help! Set up a call with one of our Sparck partners to review your results and equip you with our complimentary resources.
Here's a video walking through the Cost Analysis and research at a high level to help with presenting in an executive meeting.
Here at Sparck, we’re very invested in people analytics and actionable insights, but we know a lot of data can be overwhelming. So if you have any questions or would like to walk through your unique results in preparation for an upcoming meeting or purely to get a better understanding, we’d be thrilled to chat. Just let us know how we can best support you to increase employee engagement in your workplace, we’re here to help!
CLICK HERE TO SET UP A TIME TO CHAT
We developed this Resource Page to help you prepare for your executive meeting! We recommend taking some time to go through the different sections of the Cost Analysis so you're able to speak to the numbers and research at a high level for best results.
We've included Executive Overviews on this page, but you're welcome to dive deeper into the research and calculations if you wish!
CLICK HERE TO LEARN MORE
The #BeHeard Employee Engagement Survey is a great solution to offer your executive team after presenting the Cost Analysis.
The Free Report will help you get a pulse on how passionate your employees feel and identify what percentage of your workforce is actually disengaged. You will always have the option to upgrade to the Premium Report if you want to pull back the layers and get actionable insights for your organization and management teams. We wanted to give you options, depending on your needs and goals.
However, regardless if Sparck is the right choice for you, taking action is most important - there is a huge financial upside! Introducing your engagement solutions after you present the Cost Analysis to your executive team is critical to get buy-in and support to move forward.
CLICK HERE TO LEARN MORE
What Our Clients Are Saying
"Sparck's free Employee Engagement Cost Analysis tool was an easy and effective way to communicate how an increase in engagement can directly impact our company's performance. The customized one-page overview was a great addition to the executive meeting and gave us a way to look at our specific numbers and outline a solution. I highly recommend this tool to HR professionals who are mapping out their internal strategies and want to upgrade to the #BeHeard Premium Report."
Jennifer Hureaux, HR Manager